scipy+Opencv+numpyによる画像分類2
切り出したイメージからの続き。
import numpy as np
import cv2
import matplotlib.pyplot as plt

im = cv2.imread('bubbles.jpg')
im2 = cv2.imread('bubble2.jpg',0)

imgray = cv2.cvtColor(im,cv2.COLOR_BGR2GRAY)
ret,thresh = cv2.threshold(imgray,100,255,0)

contours, hierarchy = cv2.findContours(thresh,cv2.RETR_TREE,cv2.CHAIN_APPROX_SIMPLE)

i=3
for h,cnt in enumerate(contours):
    area = cv2.contourArea(cnt)
    if area >10000:
        mask = np.zeros(imgray.shape,np.uint8)
        cv2.drawContours(mask,[cnt],0,255,-1)
        #mean = cv2.mean(im2,mask = mask)
        #print mean
        plt.subplot(3,3,i),plt.imshow(mask,'gray')
        plt.axis('off')
        i+=1
        if i == 10:
            break
    else:
        pass
plt.subplot(3,3,3),plt.imshow(im2,'gray')
plt.axis('off')
plt.subplot(3,3,2),plt.hist(im.flat,bins=255,range=(0,255))
plt.subplot(3,3,1),plt.imshow(im,'gray')
plt.axis('off')

plt.show()

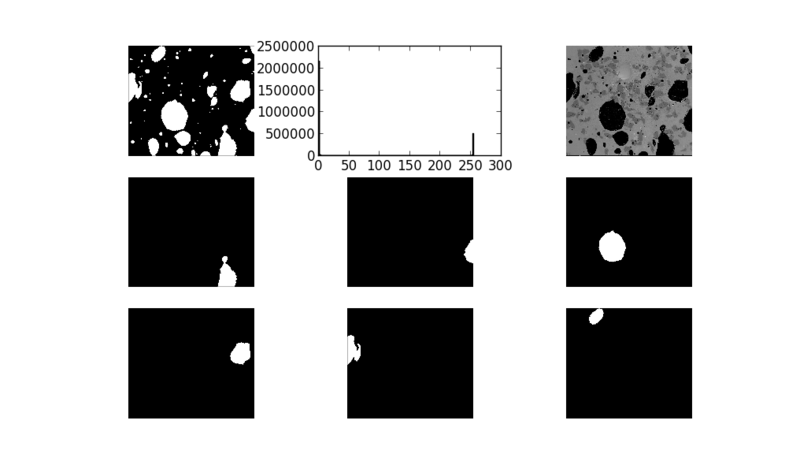
マスク画像が出来た。
mask2 =np.asarray(mask,np.bool8)
bubbles[-mask2]=0
で元画像をマスク出来る。
後日修正予定。
参考
http://opencvpython.blogspot.jp/2012/06/hi-this-article-is-tutorial-which-try.html