python+Opencvによる画像処理11(フーリエ変換2、カラー)
2次元フーリエのコード、 numpy使うと非常に簡単でした……
import cv2
import numpy as np
import pylab as plt

im = cv2.imread('lena.jpg',)

im1 = im[:,:,::-1].copy()

im_RGB = cv2.split(im1)

plt.subplot(1,4,1),plt.imshow(im1)

j = 2

title = ('Red','Green','Blue')

for i in im_RGB:
    F= np.fft.fft2(i)
    F_= np.log(5 + np.fft.fftshift(np.abs(F)))

    plt.subplot(1,4,j),plt.imshow(F_)

    plt.title(title[j-2])
    j =j + 1
plt.show()

python+Opencvによる画像解析1(ORB特徴量)
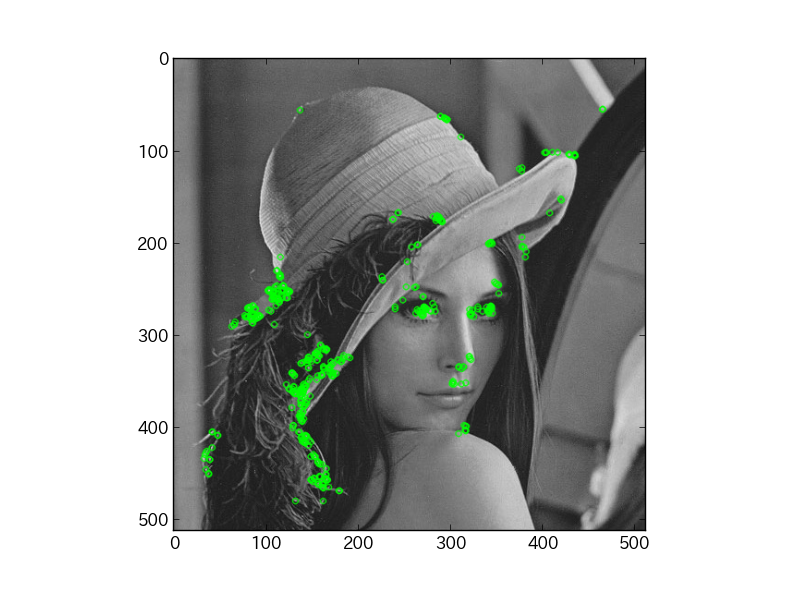
フリーの局所画像記述子であるORBによる特徴抽出
import cv2
import numpy as np
from matplotlib import pyplot as plt

img = cv2.imread('lena.jpg',0)

# 検出器の初期化
orb = cv2.ORB()


# 特徴量の検出と出力用の計算
kp, des = orb.detectAndCompute(img, None)

# 特徴の描画
img2 = cv2.drawKeypoints(img,kp,color=(0,255,0), flags=0)
plt.imshow(img2)
plt.show()

#検出器
cv2.SIFT()
cv2.BRISK()
cv2.ORB()
cv2.SURF()

#他にもFASTとMSERが使用可能

orb =cv2.ORB()
kp = orb.detect(img)
kp,des =orb.detectAndCompute(img,none)

#cv2.ORB.compute() は2.4.6で動かない(バグ?)
OpenCVとPIL(python Image library)のデータ変換
2018/5/6修正
OpenCVとPILの相互利用
OpenCVとPILのデータ変換。
PIL⇒OpenCVは下で問題なし。
import numpy as np
OpenCV_data=np.asarray(PIL_data)
OpenCV⇒PILは
from PIL import Image
PIL_data=Image.fromarray(OpenCV_data)
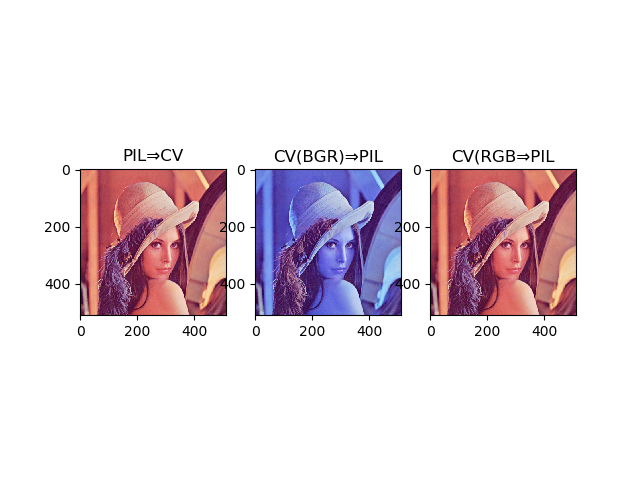
青画面の残念仕様になるので対策
import matplotlib.pyplot as plt
import cv2
import numpy as np
from PIL import Image

#OpenCVまたはPILで読み込み
CV_im = cv2.imread("lena.jpg")
PIL_im= np.array(Image.open("lena.jpg"))

#BGRからRGBへ変換
CV_im_RGB = CV_im[:, :, ::-1].copy()

#変換
PIL2CV=np.asarray(PIL_im)
CV2PIL=Image.fromarray(CV_im)
CV2PIL_normalize=Image.fromarray(CV_im_RGB)

#描画
plt.subplot(1, 3, 1), plt.imshow(PIL2CV)
plt.title(u"PIL⇒CV")
plt.subplot(1, 3, 2), plt.imshow(CV2PIL)
plt.title(u"CV(BGR)⇒PIL")
plt.subplot(1, 3, 3), plt.imshow(CV2PIL_normalize)
plt.title(u"CV(RGB⇒PIL")
plt.show()

CV_im_RGB = CV_im[:, :, ::-1].copy()
最後の::-1で逆順変換、BGR⇒RGB変換を行なっている。
python+Opencvによる画像処理10(輪郭検出)
import cv2
import numpy as np
import pylab as plt

im = cv2.imread("cat2.jpg")
im2= cv2.imread("cat2.jpg")

#グレースケール
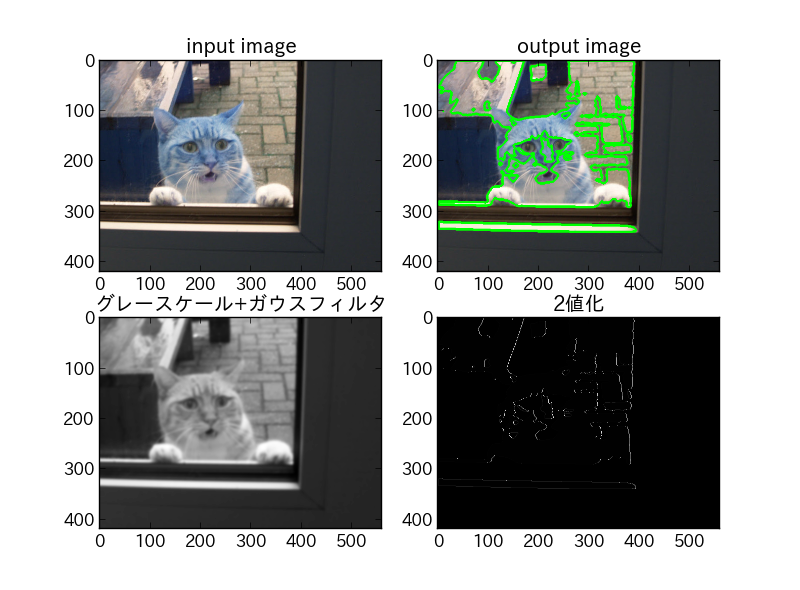
im_gray = cv2.cvtColor(im, cv2.COLOR_BGR2GRAY)

#ガウスフィルタ
im_gray_smooth=cv2.GaussianBlur(im_gray,(11,11),0)

#2値化
ret,th1 = cv2.threshold(im_gray_smooth,130,255,cv2.THRESH_BINARY)

#輪郭検出
contours, hierarchy = cv2.findContours(th1,cv2.RETR_TREE,\
                                       cv2.CHAIN_APPROX_SIMPLE)
#輪郭描画
cv2.drawContours(im,contours,-1,(0,255,0),3)

#描画
plt.subplot(2,2,1),plt.imshow(im2,'gray')
plt.title('input image')
plt.subplot(2,2,2),plt.imshow(im,'gray')
plt.title('output image')
plt.subplot(2,2,3),plt.imshow(im_gray_smooth,'gray')
plt.title(u'グレースケール+ガウスフィルタ')
plt.subplot(2,2,4),plt.imshow(th1,'gray')
plt.title(u'2値化')

plt.show()

cv2.adaptiveThresholdは細部まで行き届いている分、 輪郭検出には向いてなかった。パラメータの見直し等必要か。
Vagrant+VirtualBox環境の構築1
Vagrant
http://www.vagrantup.com/
VirtualBox
https://www.virtualbox.org/
仮想マシン置き場(URLコピー)
http://www.vagrantbox.es/
$vagrant box list
コマンドラインにて
#所持するboxのリスト
$vagrant box list
#boxの取得
$vagrant box add 任意の名前 コピーしたURL
$mkdir myOS
$cd myOS
$vagrant init 任意の名前
$ls
vagrantfile
$vagrant up
vagrantコマンドの引数
status
suspend
resume
reload#再起動
halt
up
destory
ssh
デバッグモード
$ VAGRANT_LOG=DEBUG vagrant up
現在の環境をbox化
$vagrant pakage

#package.boxが生成
#boxの追加
$vagrant add package.box 適当な名前.box
~/vagrant.d/boxesにboxファイルは保存されている。
プラグイン saharaの使用例
$vagrant plugin install sahara
uninstall
list

$vagrant sandbox on
rollback
commit
off
/vagrantフォルダが共有だが、仮想OSを再起動すると共有解除に。 vagrant halt⇒up必要になる。
python+Opencvによる画像処理9(2値化)
二値化法の比較。
import pylab as plt
plt.rcParams['font.family'] = 'IPAexGothic'
plt.rcParams['font.size'] = 12

import cv2
import numpy as np

im = cv2.imread("cat.jpg")

im_gray = cv2.cvtColor(im, cv2.COLOR_BGR2GRAY)

#Adaptive Gaussian Thresholding
th1 = cv2.adaptiveThreshold(im_gray,255,cv2.ADAPTIVE_THRESH_GAUSSIAN_C,\
            cv2.THRESH_BINARY,11,2)

#フィルター+大津
blur = cv2.bilateralFilter(im_gray,6,12,3)
ret,th2 = cv2.threshold(blur,0,255,cv2.THRESH_BINARY+cv2.THRESH_OTSU)
#フィルターのみ
ret,th3 = cv2.threshold(blur,70,255,cv2.THRESH_BINARY_INV)


print ret
plt.subplot(2,2,1),plt.imshow(im,'gray')
plt.title('input image')
plt.subplot(2,2,2),plt.imshow(th1,'gray')
plt.title('Adaptive Gaussian Thresholding')
plt.subplot(2,2,3),plt.imshow(th2,'gray')
plt.title(u"フィルター+大津")
plt.subplot(2,2,4),plt.imshow(th3,'gray')
plt.title(u"フィルターのみ")

plt.show()

cv2.waitKey(0)
cv2.destroyAllWindows()

Adaptive Gaussianの圧勝っすね。
参考(というかそのまま)
http://opencvpython.blogspot.jp/2013/05/thresholding.html
matplotlib、pylabで日本語+フォント変更
ここを見ながら実施
http://www.sakito.com/2012/01/matplotlib.html
matplotlib.matplotlib_fname()
でmatplotlibrcの場所を調べる。
$copy C:/python/site-packages/matplotlib/mpl-data/matplotlibrc ~/.matplotlib
~/.matplotlib/matplotlibrcに下記を記載する。
font.serif : MSGothic
font.sans-serif : MSGothic
import pylab as plt
plt.rcParams['font.family'] = 'MSGothic'
と入れること。